
If you scalp or day trade, you'll know that the hardest part of trading isn't the strategy itself, but managing your entries and, with them, your emotions.
I believe that if there is anything that can help a trader who decides to get involved in this business, it is understanding the market not only through price action and structure, but also through volume and context.
This last point allows us to measure and quantify the risk to avoid making too much of a mess of things when emotions overwhelm us.
I have three principles that I use in my scalping strategy that have helped me improve my success rate and consistency over the years:
- Analyze the market to understand the past, not the future
- Read the market context and sentiment constantly
- Perform market entries and exits through volume
We'll analyze each point in more detail and give some examples so you can get an idea of what I do and how I do it.
Analyze the market
If there's a quick and effective way to read the market, it's through volume. In my case, I use the volume profile to make my interpretation as objective as possible, while also making it easier to visually identify important support and resistance levels.
Let me explain.
The volume profile allows us to see the number of transactions that have been generated at each price level, so we can know whether or not there is interest when the price auction is taking place (when the price explores new zones).
For example, in the following image:
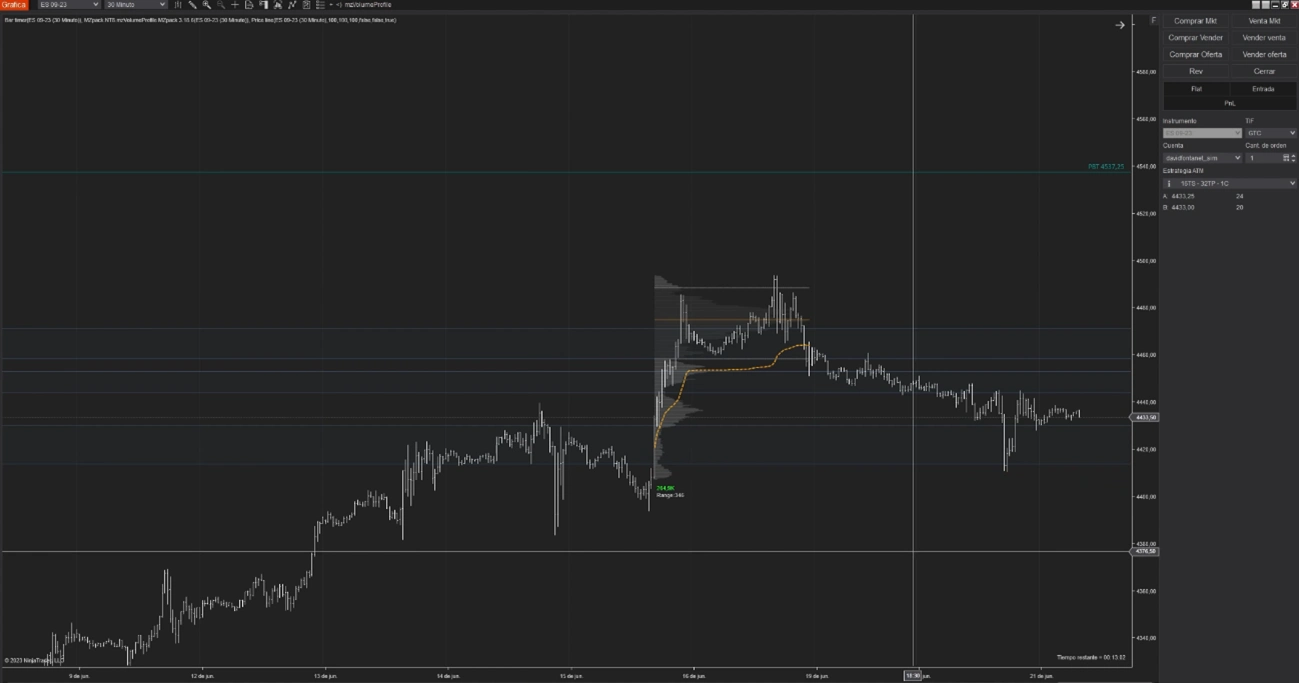
This "p"-shaped pattern tells us that the price has found interested buyers and sellers in the upper range of the pattern. In other words, there's interest in that area, regardless of what happens next. It's like when you go to the market and find a fruit stand with good pieces at a good price. You buy the best and even come back next week.
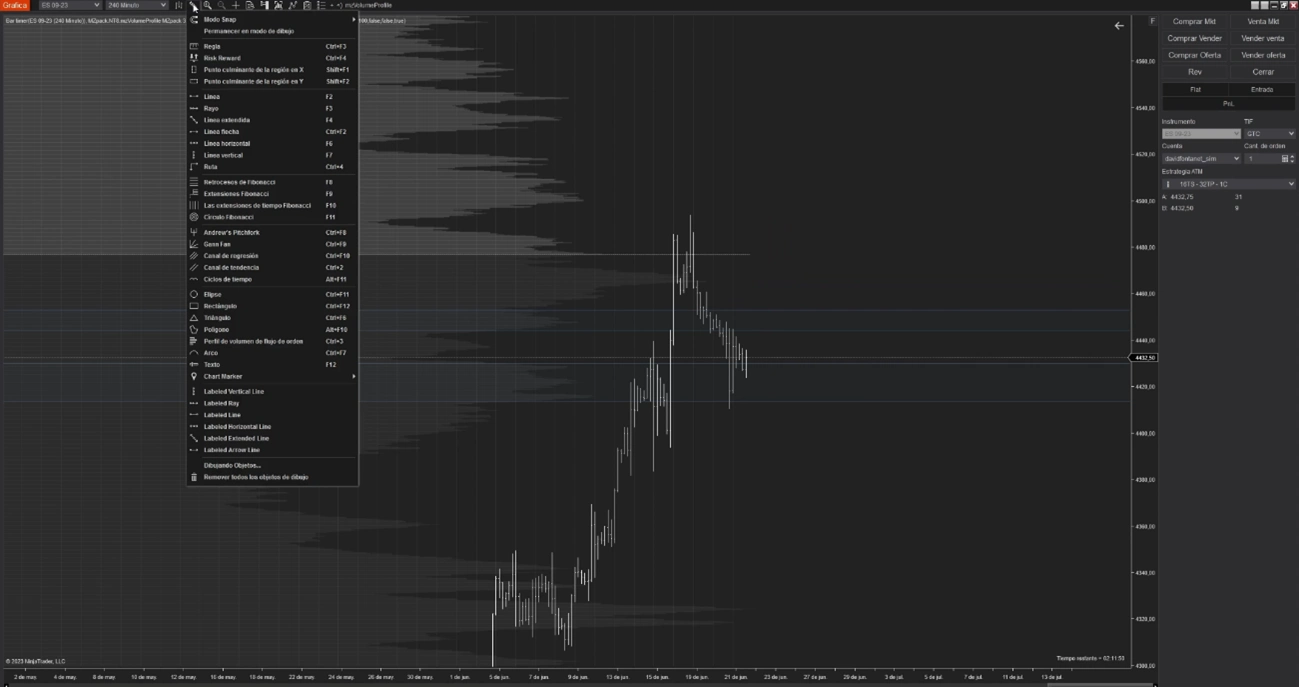
My goal during the pre-opening analysis is to identify high-volume zones and determine support and resistance levels along the edges and ends of the profile's nodes. This allows me to define levels based on volume, not just structure. These levels work much more accurately than the support and resistance levels I would mark manually, I assure you.
With these marked zones I can better understand what has happened during a major impulse, beyond what the price structure , and thus have an additional layer of information that allows me to detect traps and deceptions.
The market internals
Once I've analyzed the market and identified the areas of interest, I can better understand what has happened and how. But, most importantly, I can predict where the price might rebound and re-engage.
To validate these zones and price behavior during the session, I use tools that allow me to read market sentiment; I'm referring to market internals (see more about market internals). To measure this, I use data and information on some indices traded on the NYSE (New York Stock Exchange). This data tells me whether the price is actually moving in a certain direction because there is widespread support for it, or quite the opposite.
Click here to find the best Forex brokers
For example, if the Mini S&P 500 is made up of 500 companies and 300 of them are moving in one direction, the index is likely to eventually travel a longer distance, creating a significant imbalance. However, if only 100 companies are moving, say, upwards, what I'm observing in the price movement might not be entirely accurate. And believe it or not, this is a huge help in avoiding blind speculation.
In addition, I also use some other data that not only gives me information about the imbalances that are generated in the SP500, but also in the rest of the companies that are listed on the New York Stock Exchange.
Here's an image of the advance decline, perhaps one of the best known:
On the other hand, I try to analyze the context even more deeply. The goal is to determine the level of risk before entering the market. If it's very high, I'll abstain (that will prevent me from overtrading), and if it's low, I'll enter with more confidence and weather the storm much better.
Volume and price action
Finally, and most importantly, when I have a favorable market sentiment, I will wait for the price to cross the level I am expecting, which will usually be one of the edges of the value area (value zone of the volume profile).
At this point you might think that I'll be monitoring the thirty thousand indicators I have on my screen and will be able to calculate in advance what will happen.
No.
No way.
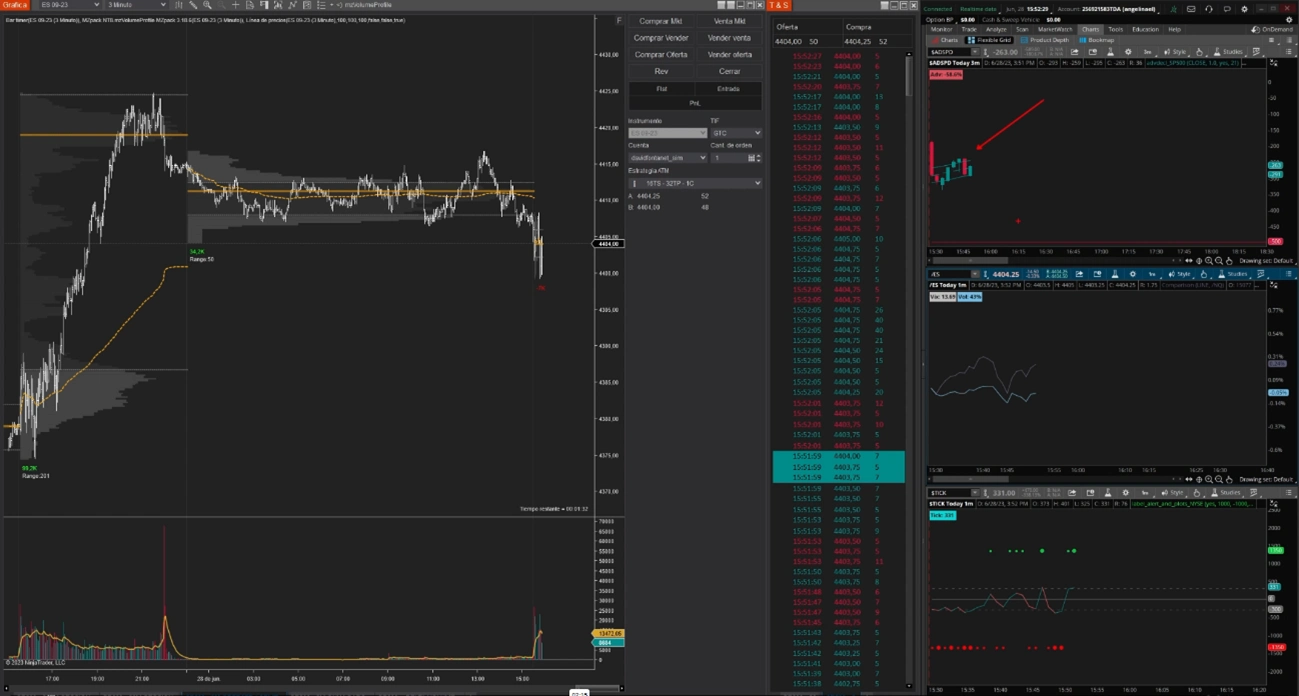
That's why I focus solely on the market volume entering the time & sales chart, or in other words, the market order tape (buy and sell orders). There, I'll look for changes in volume entry patterns that suggest the entry of large players into the market.
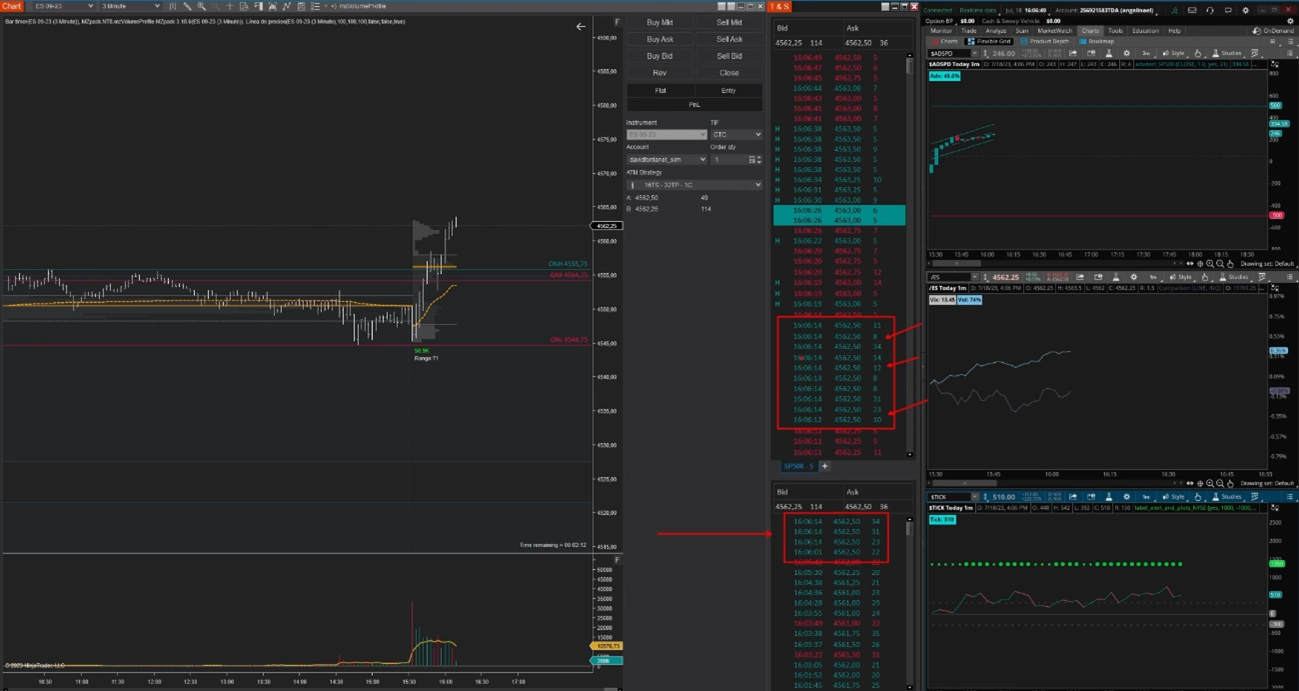
After that, I'll focus on managing the entry. Basically, cutting losses quickly and holding onto profits for as long as possible (market internals can definitely help again here).
Conclusion
Scalping is difficult. Much more so than most people involved in trading realize. Even so, if you can be disciplined long enough, you might be able to make some profit in the long run. However, truly mastering and understanding the market can take many years. I always say, I'm still learning and have a lot to learn, even after more than 5,000 hours of trading.
If you want to improve and boost your trading (whatever it may be), you can start by subscribing to my newsletter for free at davidfontanet.com.

I specialize in using Market Internals (data that provides information on market sentiment) and Volume Profile. I have 5,000 hours of experience trading the US market, specifically the Mini S&P 500.
About the author:
David Fontanet is an independent trader in the Futures markets and has specialized in Market Internals and the use of Volume Profile.
You might also be interested in
WHAT ARE THE BEST COURSES FOR INVESTING?

Futures Trading
DAY TRADING VS. SWING TRADING